Unlock data-driven decision-making with intuitive, no-code analytics—designed for everyone in your organization.
Tell data story
Just three steps to easily release the value of data
Data preparation
Rich data source interfaces, connect and integrate various data sources, and automatically create multi-dimensional analysis models.
Visualization and Analysis
Easy-to-use, highly interactive, and intuitive data analysis and visualization to help you discover and gain insight into your data.
Share value
Open and scalable architecture, providing flexible data sharing capabilities according to different business scenarios.
Drag-and-Drop Report Design
🖱️ An intuitive and flexible design experience that empowers users to quickly create and modify reports. Enhance data visualization and user experience with real-time feedback and interactive elements.
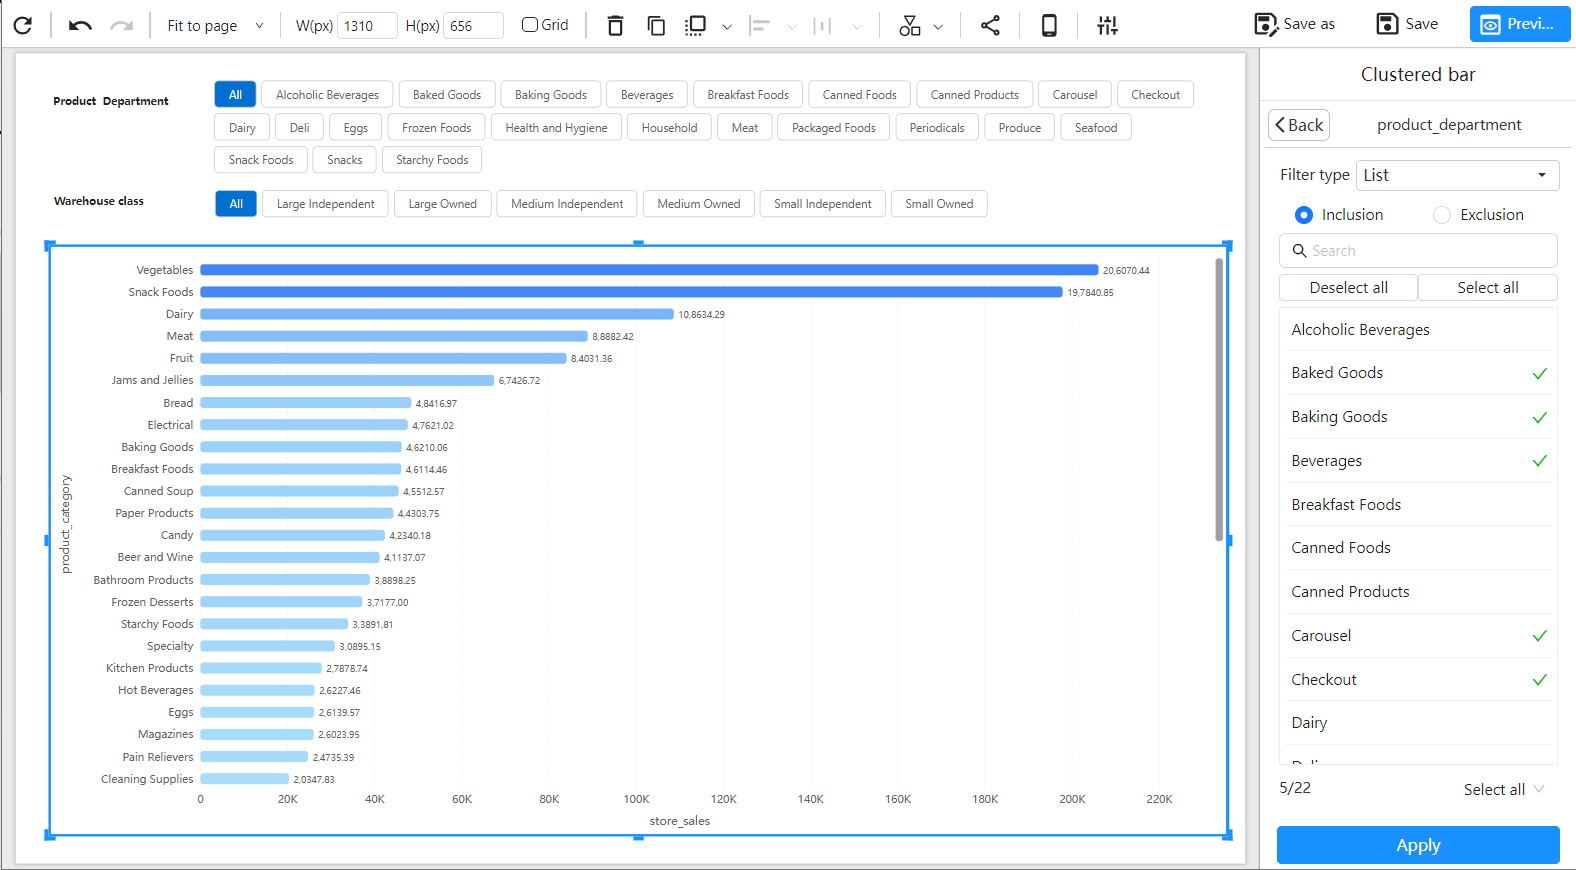
Smart Filtering
🎛️ Visual Filters: Adjust data ranges dynamically with interactive filtering tools to quickly uncover key insights.
🔍 Component-Level Filters: Apply specific conditions to display only the most relevant data, ensuring greater accuracy in analysis.
🔄 Cross-Filtering: Selecting a data point in one chart instantly updates related charts, creating a seamless data exploration experience.
In-Depth Data Exploration
🔍 Drill-Through: Click on a data point in a report to navigate to a detailed page for deeper analysis, uncovering hidden insights.
📉 Drill-Down: Explore data hierarchically within a chart, seamlessly drilling from yearly data to quarters and months for precise trend analysis.
ℹ️ Tooltips: Hover over data points to reveal detailed insights, enabling deeper business understanding.
Flexible Sorting & Advanced Calculations
🔢 Data Sorting: Easily sort data in ascending or descending order for quick access to essential insights.
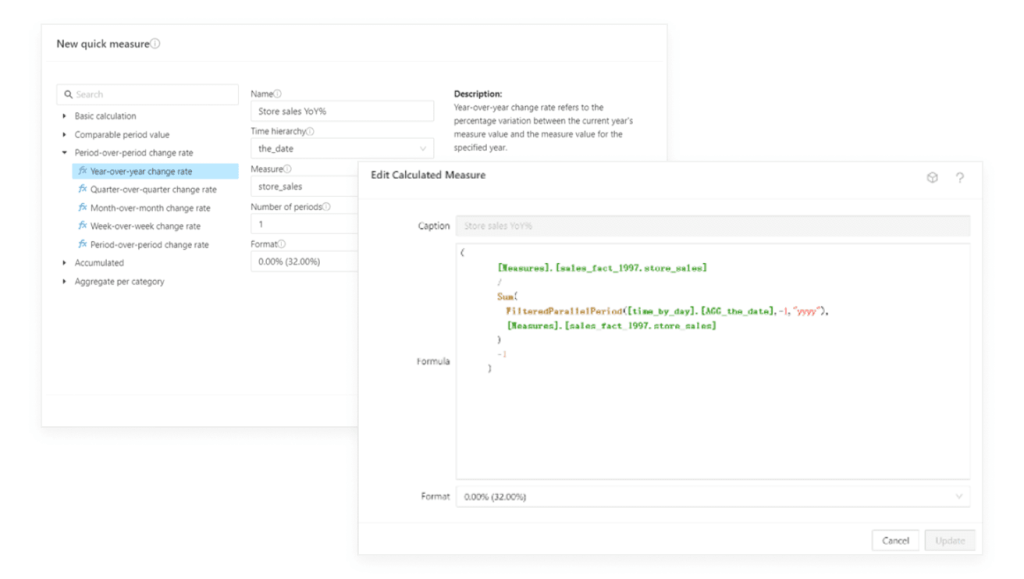
🧮 Custom Calculations: Create calculated fields and measures to perform complex data analysis tailored to your needs.
🏆 Top N Analysis: Filter and highlight the top N data points to focus on the most impactful metrics.
Cross-Model & Cross-Source Analysis
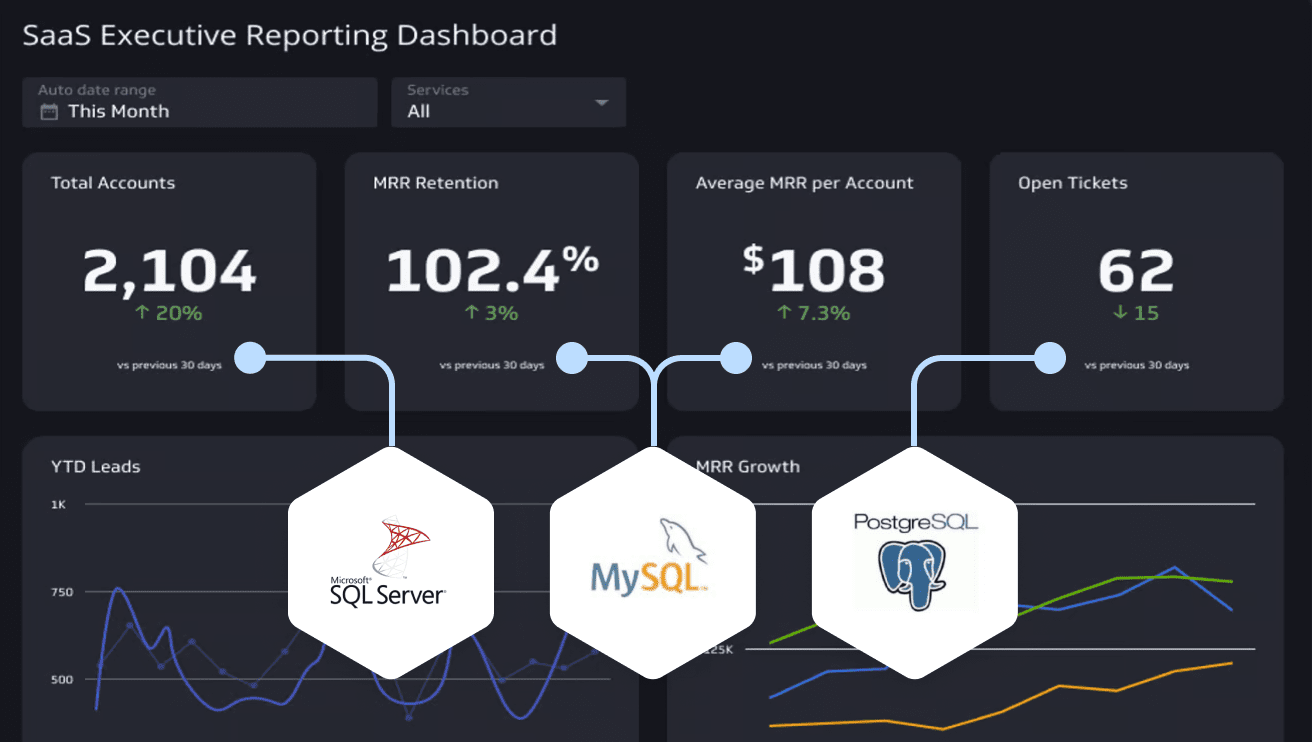
🔄 Break data silos by integrating and analyzing information from multiple models and data sources, providing a comprehensive business overview.
Data Sharing & Collaboration
🌍 Enable seamless data access through sharing and embedding, allowing users to independently create reports and visualize insights. Embedded analytics can also enhance internal operations by improving data-driven collaboration across teams.
Features
Easy to use
Drag-and-drop design, intelligent data panel, what you see is what you get, suitable for business personnel.