Datafor Visualization and Analysis
Let everyone become a data analyst, easily analyze all data, gain keen insight, and realize business innovation
How Datafor helps customers
Datafor’s unique and powerful data visualization and analysis capabilities help businesses unlock real value from their data. Everyone in the organization can ask complex data questions and gain meaningful insights.
Smart Data Integration
Datafor intelligently generates your data models, allowing you to focus on understanding your business and data while standardizing and unifying metrics. Every employee can access accurate, customizable datasets and metrics.

Telling Data Stories
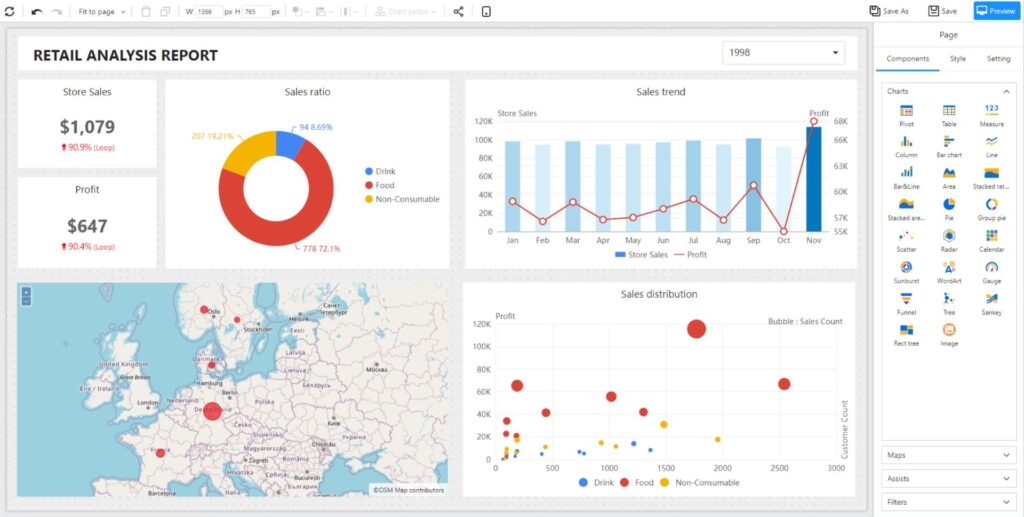
Easily create readable reports and stunning dashboards with drag-and-drop simplicity, no specialized skills required. Business analysts can share data stories and insights from any device, anytime.

Adapting to Today’s Technology
The advent of the data age has transformed our way of life, and data technology evolves rapidly. Datafor’s scalable capabilities ensure you stay ahead of technological trends and adapt to changing data visualization and analysis needs.

Building a Data-Driven Culture
One of the most critical and challenging aspects of a data-driven transformation is fostering a data-centric culture. With Datafor, your entire organization can rely on accurate, trustworthy answers.
Future-proof visualization and analytics
Rich data sources and cool visualizations, seamless embedding capabilities, integrate data analysis into all aspects of your business

Self-Service Analytics for Everyone
Datafor ensures that both technical and business users can easily turn data into value
Serving businesses with incredible speed and agility.
- Lead times are reduced from weeks, months or more to minutes.
- Connect to any data source: in the cloud, on-premises or hybrid between on-premises and cloud, public or private.
- Spend less time crunching data and reports and more time on value-added work, including data science.

Get accurate information and sales forecasts
- Accurate and timely understanding of data from CRM, ERP and other systems to grasp business trends.
- The quarterly business review (QBR) is ready on the first day of each quarter.
- Give finance and sales leadership confidence in the data you report.
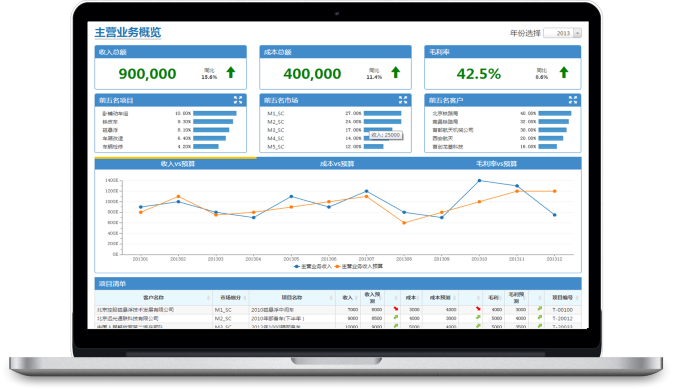
Create a unified financial view for the enterprise.
- Cross-department unified financial caliber and performance indicators to obtain correct financial analysis results.
- Reduce the extensive work of collecting, merging, and formatting data for finance teams.
- Provide reliable and timely data and real-time indicators for company management’s goals.
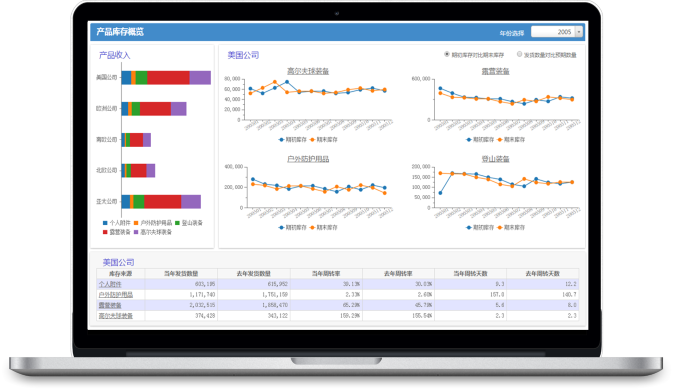
Comprehensive insight and understanding of company health
- Eliminate silos, increase efficiency, and gain unified access to all your operational and customer data for a clear view of your entire business.
- Communicate the health of your company through intuitive visualizations.
- Increase efficiency with pre-built best practice metrics and KPIs.
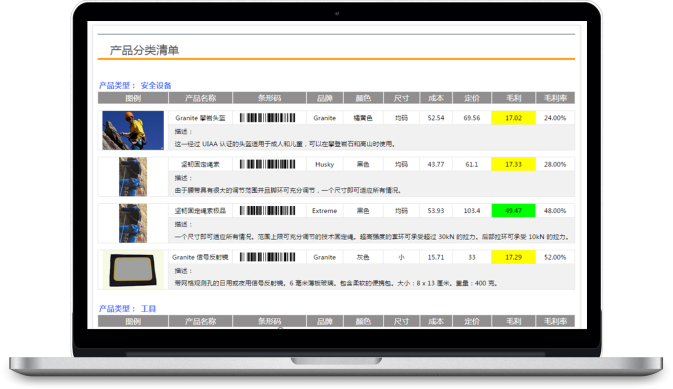
Make Data-Driven Decisions
- View metrics on any mobile device, wherever you are, and measure success across your company.
- Monitor employee performance, employee turnover, identify problems and take corrective action.
- One-stop tracking of project completion progress in production, sales, finance, marketing, etc.
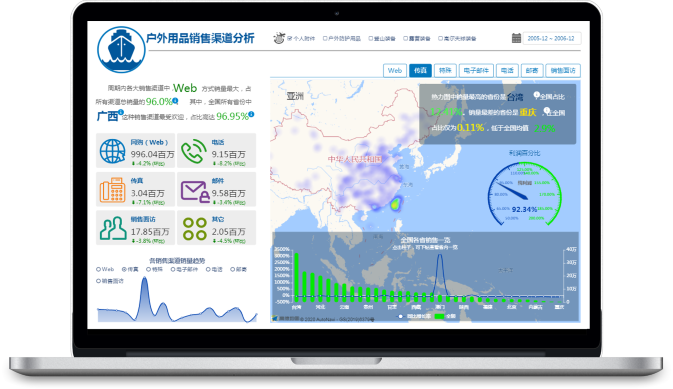
Advantages of Datafor

Excellent User Experience
Intuitive and role-based insights, WYSIWYG design experience, convenient for users to build their own data visualization and analysis documents.

Lower total cost of ownership
"Agile" ensures less workload, and lightweight deployment reduces operation and maintenance costs, thereby reducing total cost of ownership.

Wide range of applications
It is suitable for mobile applications, large digital screens, big data platforms, real-time data display, and integrates analysis into all business.

Adapt to the future
Not just OLAP analysis, augmented analysis brings more automation momentum and innovative insights to analysis plans.
Immediately experience Datafor data visualization and analysis
Deploy locally or cloud
Local deploy
Use the enterprise's local computing and storage resources for local deployment, analyze any data in the enterprise intranet, and embed enterprise analysis applications.
Cloud deploy
Use cloud computing and storage to deploy private cloud, public cloud, and hybrid cloud, and support mainstream cloud platforms such as Alibaba Cloud, Huawei Cloud, Tencent Cloud, and Amazon AWS.

