Use self-service BI and rich visualization to build interactive dashboards and help business users move faster from questions to answers.
Self-service design
Build dashboards with drag-and-drop.
Interactive filtering
Filter, compare, and link views quickly.
Multi-level drill
Move from summary to detail.
Rich visuals
Combine charts, tables, and KPIs flexibly.
Multi-device
Fit desktop, mobile, and big-screen use.
WHY IT FEELS DIFFERENT
Built for interactive analysis, not static reporting
Give business users the ability to filter, compare, drill, and inspect details while reducing repetitive reporting requests.
Answer follow-up questions without creating a new report
Let users filter, drill, sort, and compare data on their own
Explore the same dataset from different business angles
Free analysts from repetitive requests and focus on deeper insights
STATIC REPORTING
Built mainly for viewing
Limited interaction after publishing.
Every new question may require a new report.
Visual formats are harder to adapt.
SELF-SERVICE BI
Built for exploration and iteration
Filter, drill, sort, and compare on demand.
Fit more roles and business scenarios.
Make analytics easier to use across the business.
Dashboard design
Flexible layout for fast business-ready pages
Interactive analysis
Support filters, drill paths, sorting, and detail views
Visual expression
Use charts, tables, and KPIs for different audiences
More than basic charts
Support KPIs, trend charts, pivot views, maps, and more.
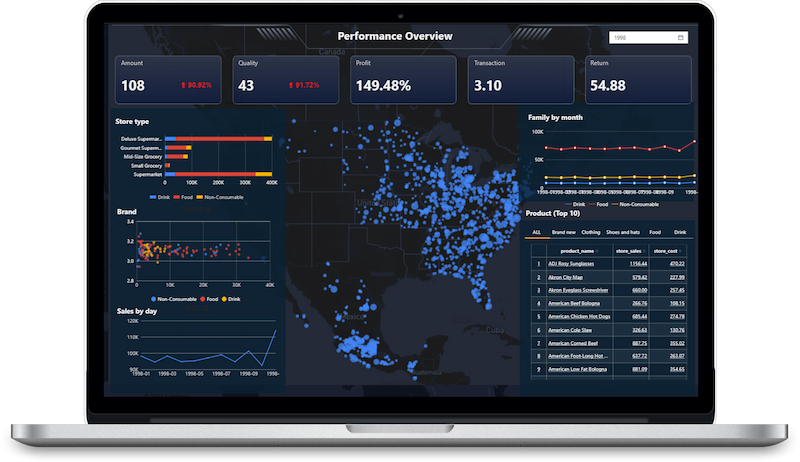
KPI & overview
Highlight core metrics and quick status signals.
Trend comparison
Track change over time and compare performance.
Detail & pivot
Move from summary views into detailed analysis.
Map analysis
Present regional patterns and geographic distribution.
Executive dashboards
Combine key visuals into one focused decision view.
USE CASES
One platform for every team and every analytics experience
Support internal dashboards, operational reporting, and customer-facing analytics from one trusted foundation.
For executives
A clear KPI view for leadership.
Bring core metrics, trends, and exceptions into one executive dashboard.
Customer-facing SaaS analytics
Review trends and exceptions quickly.
Support faster decision cycles.
KPI overview
Trend analysis
Executive review
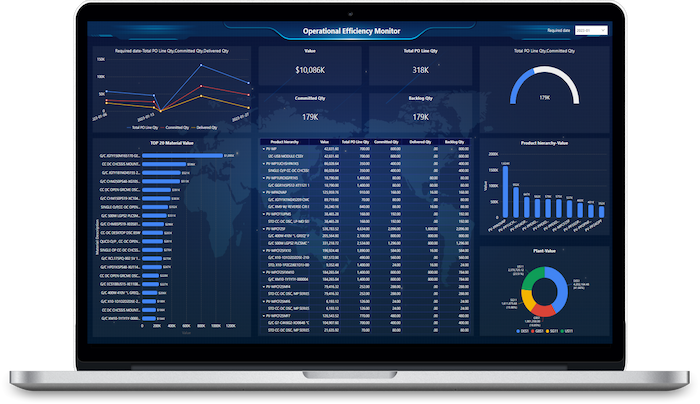
For operations teams
A live view of operational performance.
Track service levels, workloads, and exceptions in one operational dashboard.
Monitor key metrics and thresholds in real time.
Detect bottlenecks, incidents, and anomalies early.
Keep day-to-day execution visible across teams.
Real-time monitoring
Exception management
Operational alerts
For business teams
A structured view for business reviews.
Bring targets, performance trends, and variance analysis into one review-ready dashboard.
Compare actuals against plan and prior periods.
Highlight the main drivers behind performance changes.
Support more consistent monthly and quarterly reviews.
Plan vs. actual
Variance analysis
Review readiness
For customer-facing use cases
Analytics your customers can use directly.
Deliver secure dashboards and reports inside your product, portal, or service experience.
Provide role-based views for different customer audiences.
Let users explore key metrics without leaving your application.
Maintain governance across internal and external analytics.
Embedded dashboards
Role-based access
Self-service analytics
Access and delivery
Multi-screen output, kept simple
Desktop dashboards
Support detailed business analysis and multi-component layouts.
Mobile views
Present key metrics and focused insights on smaller screens.
Large-screen display
Use visualization pages in command centers and executive meeting spaces.
Role-ready delivery
Create different views for operations, management, sales, finance, and more.
Bring richer analysis into everyday decisions
Use self-service BI and rich data visualization to give business users a clearer, faster way to explore data and answer follow-up questions on their own.